

组件架构
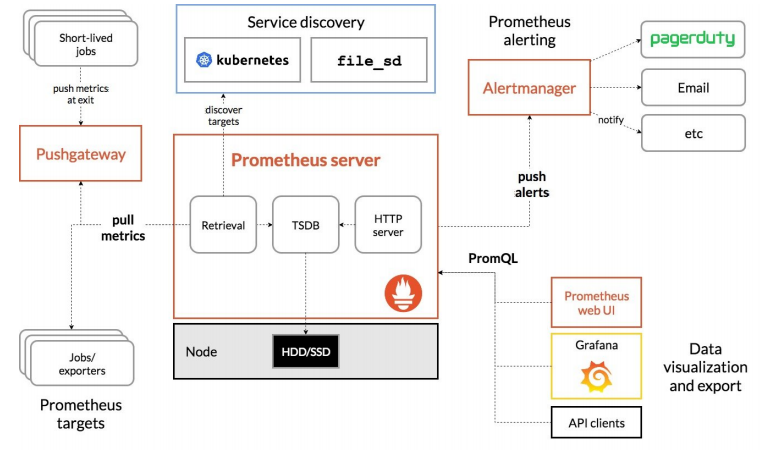
- Prometheus server是Prometheus架构中的核心组件,基于go语言编写而成,无第三方依赖关系,可以独立部署在物理服务器上、云主机、Docker容器内。主要用于收集每个目标数据,并存储为时间序列数据,对外可提供数据查询支持和告警规则配置管理。
- Prometheus服务器可以对监控目标进行静态配置管理或者动态配置管理,它将监控采集到的数据按照时间序列存储在本地磁盘的时序数据库中(当然也支持远程存储),自身对外提供了自定义的PromQL语言,可以对数据进行查询和分析
- Client Library是用于检测应用程序代码的客户端库。在监控服务之前,需要向客户端库代码添加检测实现Prometheus中metric的类型。
- Exporter(数据采集)用于输出被监控组件信息的HTTP接口统称为Exporter(导出器)。目前互联网公司常用的组件大部分都有Expoter供直接使用,比如Nginx、MySQL、linux系统信息等。
- Pushgateway是prometheus的一个组件,prometheus server默认是通过exporter主动获取数据(默认采取pull拉取数据),pushgateway则是通过被动方式推送数据到prometheus server,用户可以写一些自定义的监控脚本把需要监控的数据发送给pushgateway, 然后pushgateway再把数据发送给Prometheus server,可以解决不在一个网段的问题。(Pushgateway是指用于支持短期临时或批量计划任务工作的汇聚节点。主要用于短期的job,此类存在的job时间较短,可能在Prometheus来pull之前就自动消失了。所以针对这类job,设计成可以直接向Pushgateway推送metric,这样Prometheus服务器端便可以定时去Pushgateway拉去metric)
- Alertmanager主要用于处理Prometheus服务器端发送的alerts信息,对其去除重数据、分组并路由到正确的接收方式,发出告警,支持丰富的告警方式。
- Service Discovery:动态发现待监控的target,从而完成监控配置的重要组件,在容器环境中尤为重要,该组件目前由Prometheus Server内建支持。
此次部署的服务相应位置:
192.168.106.10:
- prometheus (服务端)
- Grafana
- Alertmanger
192.168.106.30:
- node_exporter
- mysqld_exporter
安装prometheus (服务端)
下载网址https://prometheus.io/download/
关闭防火墙和selinux
[root@server1 prometheus]# systemctl stop firewalld
[root@server1 prometheus]# setenforce 0
下载安装包,配置安装目录
[root@server1 ~]# wget https://github.com/prometheus/prometheus/releases/download/v2.25.0/prometheus-2.25.0.linux-amd64.tar.gz[root@server1 ~]# mkdir /data
[root@server1 ~]# tar -zxvf prometheus-2.25.0.linux-amd64.tar.gz  -C /data/
[root@server1 ~]# cd /data/
[root@server1 data]# chown -R root:root /data/prometheus-2.25.0.linux-amd64
[root@server1 data]# ln -sv prometheus-2.25.0.linux-amd64 prometheus
"prometheus" -> "prometheus-2.25.0.linux-amd64"
启动prometheus
[root@server1 data]# yum install -y screen
[root@server1 data]# screen -S prom
#创建screen来防止前台运行prometheus后节点占用问题,退出screen按ctrl+a+d,再次进入按screen -r prom
#prom为自己起的名字
[root@server1 data]# cd /data/prometheus
[root@server1 prometheus]# ./prometheus
level=info ts=2021-02-28T06:03:36.885Z caller=main.go:366 msg="No time or size retention was set so using the default time retention" duration=15d
level=info ts=2021-02-28T06:03:36.885Z caller=main.go:404 msg="Starting Prometheus" version="(version=2.25.0, branch=HEAD, revision=a6be548dbc17780d562a39c0e4bd0bd4c00ad6e2)"
level=info ts=2021-02-28T06:03:36.885Z caller=main.go:409 build_context="(go=go1.15.8, user=root@615f028225c9, date=20210217-14:17:24)"
level=info ts=2021-02-28T06:03:36.885Z caller=main.go:410 host_details="(Linux 3.10.0-693.el7.x86_64 #1 SMP Tue Aug 22 21:09:27 UTC 2017 x86_64 server1 (none))"
level=info ts=2021-02-28T06:03:36.885Z caller=main.go:411 fd_limits="(soft=1024, hard=4096)"
level=info ts=2021-02-28T06:03:36.885Z caller=main.go:412 vm_limits="(soft=unlimited, hard=unlimited)"
level=info ts=2021-02-28T06:03:36.891Z caller=web.go:532 component=web msg="Start listening for connections" address=0.0.0.0:9090
level=info ts=2021-02-28T06:03:36.895Z caller=main.go:779 msg="Starting TSDB ..."
level=info ts=2021-02-28T06:03:36.897Z caller=tls_config.go:191 component=web msg="TLS is disabled." http2=false
level=info ts=2021-02-28T06:03:36.930Z caller=head.go:668 component=tsdb msg="Replaying on-disk memory mappable chunks if any"
level=info ts=2021-02-28T06:03:36.930Z caller=head.go:682 component=tsdb msg="On-disk memory mappable chunks replay completed" duration=5.69µs
level=info ts=2021-02-28T06:03:36.930Z caller=head.go:688 component=tsdb msg="Replaying WAL, this may take a while"
level=info ts=2021-02-28T06:03:36.933Z caller=head.go:740 component=tsdb msg="WAL segment loaded" segment=0 maxSegment=0
level=info ts=2021-02-28T06:03:36.933Z caller=head.go:745 component=tsdb msg="WAL replay completed" checkpoint_replay_duration=38.416µs wal_replay_duration=2.357106ms total_replay_duration=2.638813ms
level=info ts=2021-02-28T06:03:36.934Z caller=main.go:799 fs_type=XFS_SUPER_MAGIC
level=info ts=2021-02-28T06:03:36.934Z caller=main.go:802 msg="TSDB started"
level=info ts=2021-02-28T06:03:36.934Z caller=main.go:928 msg="Loading configuration file" filename=prometheus.yml
此时当终端关闭或者按下ctrl + c服务会自动关闭,若仍然后台运行则现用ps -aux |9090找到pid,再kill -9 pid杀死进程
#热加载更新配置
[root@server1 ~]# ps -aux |grep 9090
#找到prometheus进程的pid,9090为运行服务的端口号
[root@server1 ~]# kill -HUP pid
#重启服务
#检查配置文件的语法正确性
[root@server1 ~]# cd /data/prometheus
[root@server1 prometheus]# ./promtool check config prometheus.yml
#使用的是 prometheus自带的工具promtool
Checking prometheus.yml
  SUCCESS: 0 rule files found
完成prometheus (服务端)的部署,可以通过http://192.168.106.10:9090进行访问
安装Exporter(Linux主机监控)
下载网址https://prometheus.io/download/
下载二进制包,配置安装目录
[root@server2 ~]# wget https://github.com/prometheus/node_exporter/releases/download/v1.1.1/node_exporter-1.1.1.linux-amd64.tar.gz
[root@server2 ~]# mkdir /data
[root@server2 ~]# tar -zxvf node_exporter-1.1.1.linux-amd64.tar.gz -C /data/
node_exporter-1.1.1.linux-amd64/
node_exporter-1.1.1.linux-amd64/LICENSE
node_exporter-1.1.1.linux-amd64/NOTICE
node_exporter-1.1.1.linux-amd64/node_exporter
[root@server2 ~]# cd /data/
[root@server2 data]# chown -R root:root node_exporter-1.1.1.linux-amd64
[root@server2 data]# ln -sv node_exporter-1.1.1.linux-amd64 node_exporter
"node_exporter" -> "node_exporter-1.1.1.linux-amd64"
启动node_exporter
端口号为9100
[root@server2 ~]# cd /data/node_exporter
[root@server2 data]# yum install -y screen
[root@server2 data]# screen -S node
[root@server2 node_exporter]# ./node_exporter
重新编辑prometheus配置文件(服务端)
[root@server1 prometheus]# vim prometheus.yml

scrape_configs:
  # The job name is added as a label `job=<job_name>` to any timeseries scraped from this config.
  - job_name: 'prometheus'

    # metrics_path defaults to '/metrics'
    # scheme defaults to 'http'.

    static_configs:
    - targets: ['localhost:9090']
  - job_name: 'node_exporter'      #在此处添加新的job
    static_configs:
      - targets: [192.168.106.30:9100]

[root@server1 ~]# kill -HUP pid
#重启服务
安装Exporter(MySQL监控)
下载网址https://prometheus.io/download/
下载安装包,配置安装目录
[root@server2 ~]# wget https://github.com/prometheus/mysqld_exporter/releases/download/v0.12.1/mysqld_exporter-0.12.1.linux-amd64.tar.gz
[root@server2 ~]# tar -xzvf mysqld_exporter-0.12.1.linux-amd64.tar.gz -C /data/
mysqld_exporter-0.12.1.linux-amd64/
mysqld_exporter-0.12.1.linux-amd64/NOTICE
mysqld_exporter-0.12.1.linux-amd64/mysqld_exporter
mysqld_exporter-0.12.1.linux-amd64/LICENSE
[root@server2 ~]# cd /data/
[root@server2 data]# chown root:root mysqld_exporter-0.12.1.linux-amd64 -R
[root@server2 data]# ln -sv mysqld_exporter-0.12.1.linux-amd64   mysqld_exporter
"mysqld_exporter" -> "mysqld_exporter-0.12.1.linux-amd64"
创建MySQL授权用户
[root@server2 ~]# yum install mariadb-server.x86_64 -y
[root@server2 ~]# systemctl start mariadb
[root@server2 ~]# mysql_secure_installation
#mariadb安全登录
[root@server2 ~]# mysql -uroot -p
Enter password:
Welcome to the MariaDB monitor.  Commands end with ; or \g.
Your MariaDB connection id is 10
Server version: 5.5.68-MariaDB MariaDB Server

Copyright (c) 2000, 2018, Oracle, MariaDB Corporation Ab and others.

Type 'help;' or '\h' for help. Type '\c' to clear the current input statement.

MariaDB [(none)]> create user 'mysqld_exporter'@'%' identified by '1';
Query OK, 0 rows affected (0.00 sec)

MariaDB [(none)]> grant process,replication client,select on *.* to 'mysqld_exporter'@'%';
Query OK, 0 rows affected (0.00 sec)

MariaDB [(none)]> flush privileges;
Query OK, 0 rows affected (0.00 sec)
MariaDB [(none)]> select host,user from mysql.user;
+-----------+-----------------+
| host      | user            |
+-----------+-----------------+
| %         | mysqld_exporter |
| 127.0.0.1 | root            |
| ::1       | root            |
| localhost | root            |
+-----------+-----------------+
4 rows in set (0.00 sec)
配置数据库认证
[root@server2 mysqld_exporter]# vim /data/mysqld_exporter/.mysqld_exporter.cnf

[client]
user=mysqld_exporter
password=1
启动mysqld_exporter
端口号为9104
[root@server2 ~]# cd /data/mysqld_exporter
[root@server2 data]# yum install -y screen
[root@server2 data]# screen -S mysqld
[root@server2 mysqld_exporter]# ./node_exporter
重新编辑prometheus配置文件(服务端)
[root@server1 prometheus]# vim prometheus.yml
#与上次添加job的位置相同

  - job_name: 'mysqld_exporter'
    scrape_interval: 10s
    static_configs:
      - targets: [192.168.106.30:9104]

[root@server1 ~]# kill -HUP pid
重启服务
配置服务发现
Prometheus服务发现能够自动化检测分类,并且能够识别新目标和变更目标。也就是说,可以自动发现并监控目标或变更目标,动态进行数据采集和处理。
添加配置文件
[root@server1 prometheus]# mkdir /data/prometheus/targets
[root@server1 prometheus]# vim targets/dev_node.json
[{
    "targets": [ "192.168.106.30:9100","192.168.106.30:9104" ],
    "labels": {
         "env": "dev_webgame"
        }
}]
-------------------------------------------------------------------
或者这里是准备yaml文件,那么下面相应的配置文件需要与yaml匹配
vim targets/dev_node.yml
- targets:
  - "192.168.106.30:9100"
  - "192.168.106.30:9104"
修改prometheus配置文件
[root@server1 prometheus]# vim /data/prometheus/prometheus.yml #将原来添加的node_exporter和mysqld_exporter的job删除,在原处添加
- job_name: 'node_service_discovery'
file_sd_configs:
- files:
- targets/*.yml #若上面targets中写的文件为.json格式,则yml改为json
refresh_interval: 60m
[root@server1 ~]# kill -HUP pid
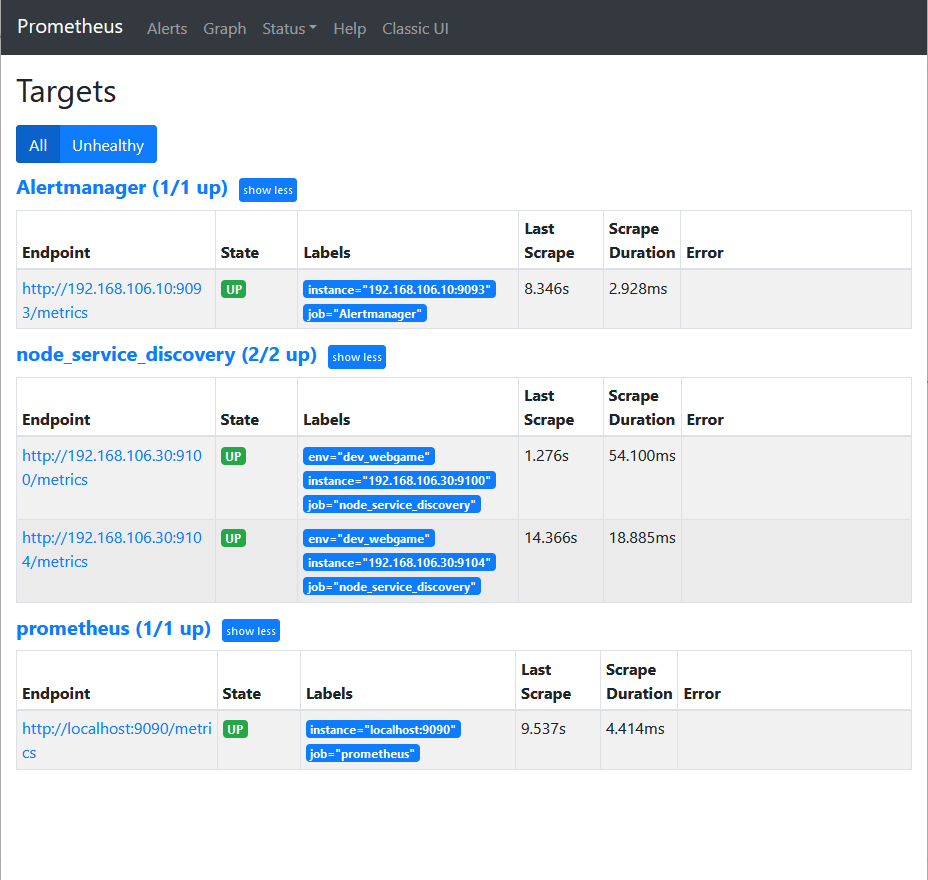
#重启服务只要job部署成功,就可在网站Status->Targets中看到如下界面
PS:此图为我部署全部的job之后所截,仅作为参考
安装Grafana(图形工具)
下载网址https://prometheus.io/download/
PS:这里安装可以采用不同的服务器,但是因为是实验所以无所谓,仍使用server1
下载二进制包
[root@server1 ~]# wget https://dl.grafana.com/oss/release/grafana-7.5.3-1.x86_64.rpm
[root@server1 ~]# yum install grafana-7.5.3-1.x86_64.rpm -y
启动grafana
端口号为3000
[root@server1 ~]# systemctl start grafana-server.service
[root@server1 ~]# systemctl enable grafana-server.service
Created symlink from /etc/systemd/system/multi-user.target.wants/grafana-server.service to /usr/lib/systemd/system/grafana-server.service.
登录grafana
完成grafana的部署,可以通过http://192.168.106.10:9090进行访问
首次登陆用户名密码为admin admin,之后要修改密码

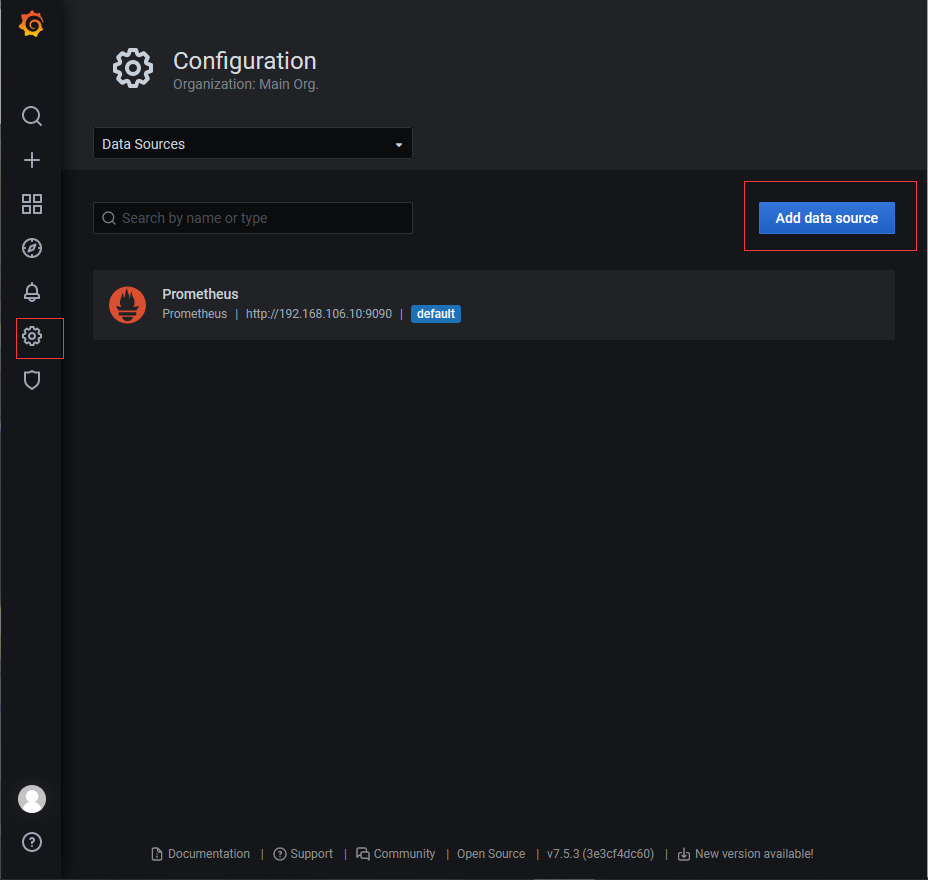
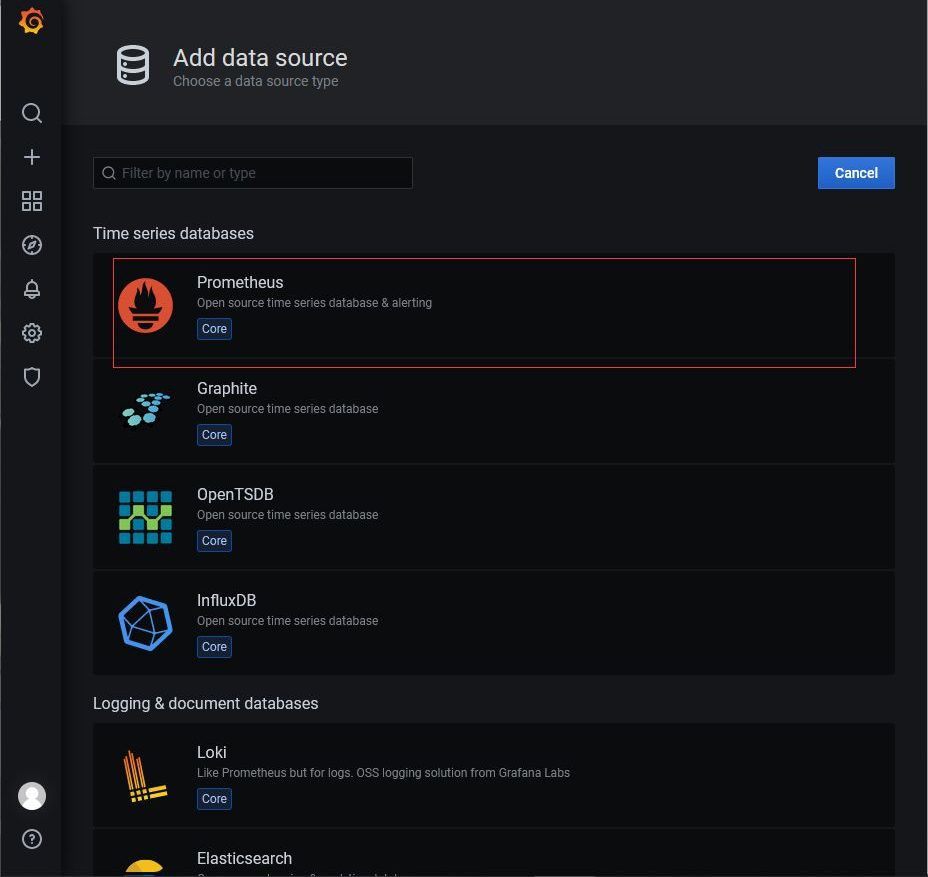
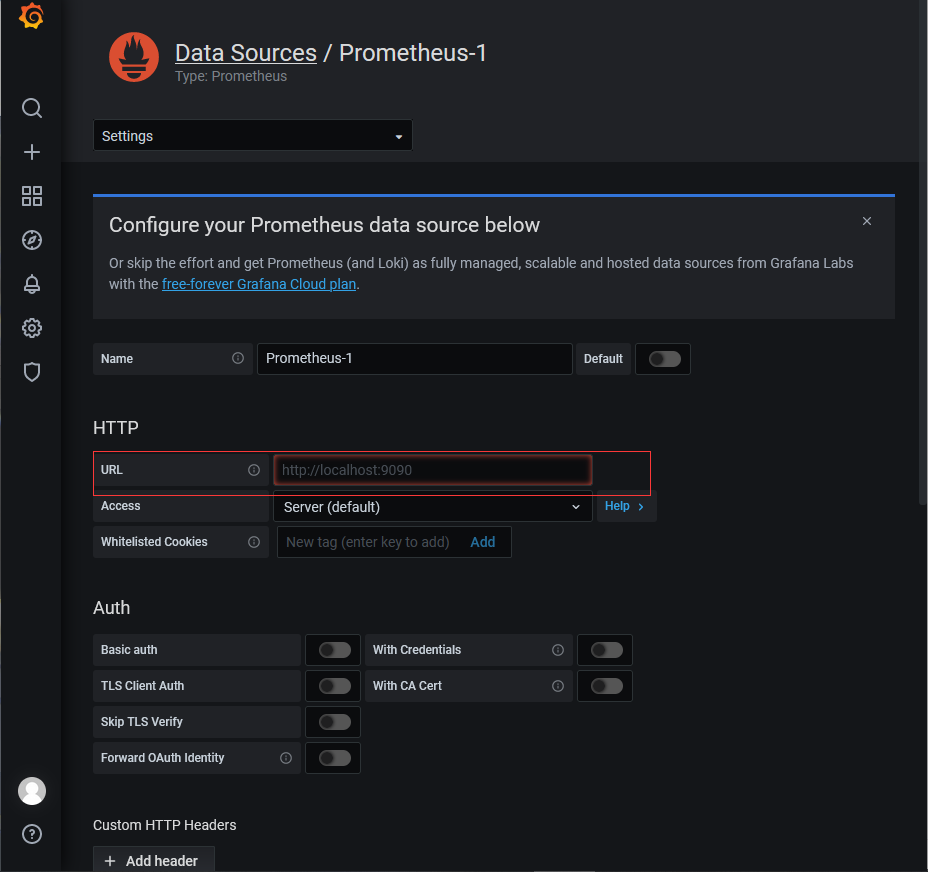
添加数据源
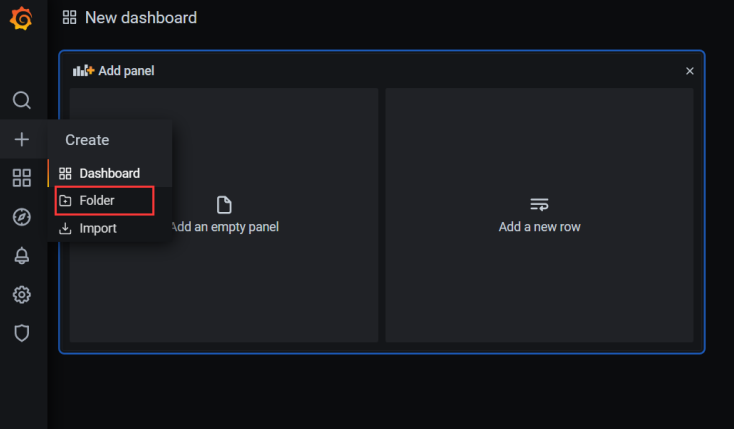
添加dashboard
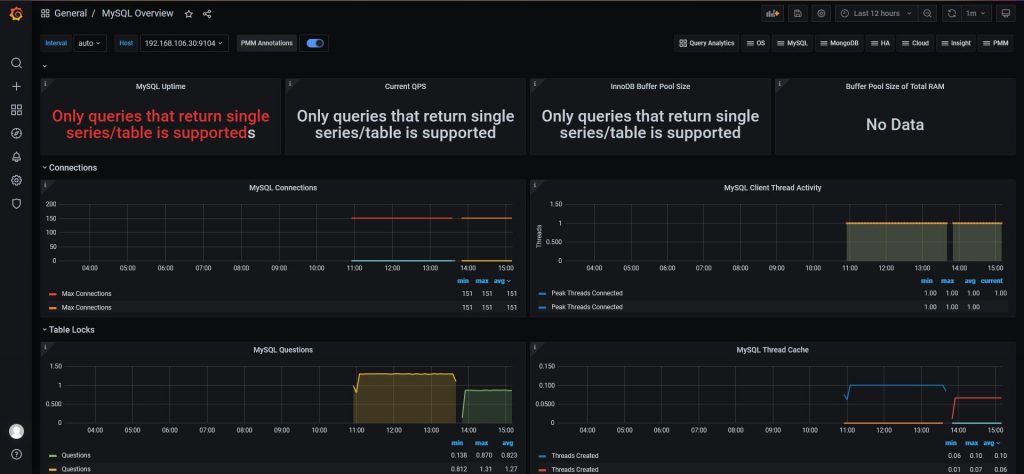
人工创建图表比较繁琐,可以直接导入已经存在的模板
可以通过访问 https://grafana.com/dashboards 来查看已有仪表盘模板,选取合适的使用。
参考网址:https://www.cnblogs.com/xuliuzai/p/11134714.html
下图为导入MySQL模板的图表:
安装Alertmanager(告警)
PS:这里安装可以采用不同的服务器,但是因为是实验所以无所谓,仍使用server1
报警逻辑:
- 在AlertManager上定义receiver,他们能够基于某个媒介接收告警信息的特定用户;在Alertmanager上定义路由规则(route),以便将收到的告警通知按需分别进行处理在Prometheus上定义告警规则生成告警通知,发送给Alertmanager
下载安装包,配置安装目录
[root@server1 ~]# wget https://github.com/prometheus/alertmanager/releases/download/v0.21.0/alertmanager-0.21.0.linux-amd64.tar.gz
#[root@server1 ~]# mkdir /data
#如果是不同的服务器则新创建目录
[root@server1 ~]# tar -zxvf alertmanager-0.21.0.linux-amd64.tar.gz -C /data/
[root@server1 ~]# cd /data/
[root@server1 data]# chown -R root:root alertmanager-0.21.0.linux-amd64
[root@server1 data]# ln -sv alertmanager-0.21.0.linux-amd64   alertmanager
"alertmanager" -> "alertmanager-0.21.0.linux-amd64"
自定义qq邮箱报警的配置文件
[root@server1 alertmanager]# vim /data/alertmanager/alertmanager.yml
global:
resolve_timeout: 5m
smtp_from: '2542230907@qq.com' #修改发送邮件的qq邮箱
smtp_smarthost: 'smtp.qq.com:465' #修改发送邮件的qq邮箱
smtp_auth_username: '2542230907@qq.com'
smtp_auth_password: '****************' #qq邮箱授权码
smtp_require_tls: false
smtp_hello: 'qq.com'
route:
group_by: ['alertname']
group_wait: 5s
group_interval: 5s
repeat_interval: 5m
receiver: 'email'
receivers:
- name: 'email'
email_configs:
- to: '257592112@qq.com' #修改接受邮件的qq邮箱
send_resolved: true
inhibit_rules:
- source_match:
severity: 'critical'
target_match:
severity: 'warning'
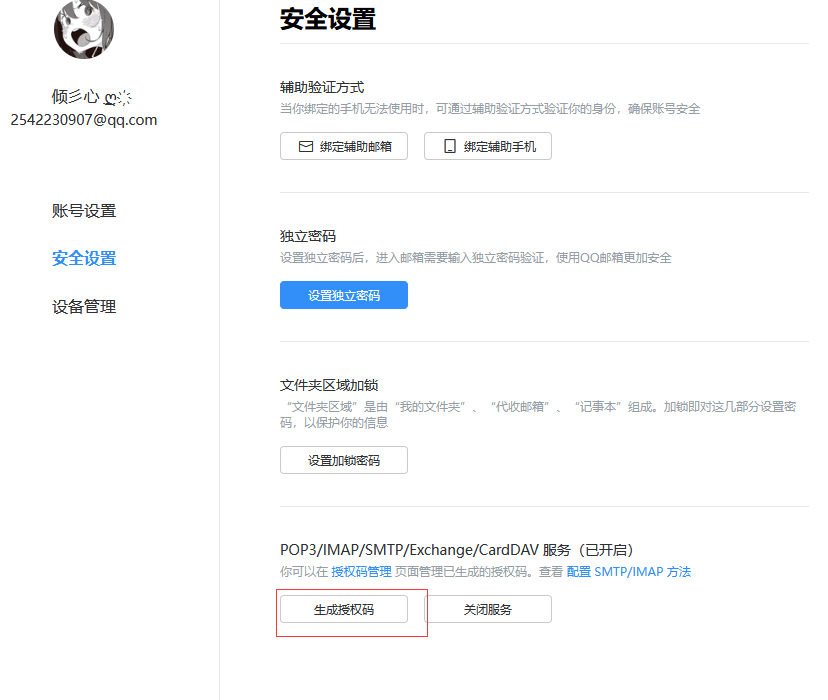
equal: ['alertname', 'dev', 'instance']qq邮箱授权码获取:
登录->设置->账号->POP3/IMAP/SMTP/Exchange/CardDAV/CalDAV服务->管理服务
启动Alertmanager
服务端口号9093
[root@server1 ~]# cd /data/alertmanager
#[root@server1 data]# yum install -y screen
[root@server1 data]# screen -S alert
[root@server1 mysqld_exporter]# ./alertmanager
重新编辑prometheus配置文件(服务端)
[root@server1 prometheus]# cat prometheus.yml

alerting:
  alertmanagers:
  - static_configs:
    - targets:
      # - alertmanager:9093
      - 192.168.106.10:9093   #启用Alertmanager的服务器,仅添加这一行
.......
scrape_configs:
  - job_name: 'Alertmanager'
    static_configs:
      - targets: ['192.168.106.10:9093']
#在老位置添加新job
配置告警规则(服务端)
[root@server1 prometheus]# mkdir -p /data/prometheus/rules/
[root@server1 prometheus]# vim prometheus.yml

rule_files:
  - "/data/prometheus/rules/*.yml"

[root@server1 rules]# vim /data/prometheus/rules.yml
groups:
- name: up
  rules:
  - alert: node
    expr: up{job="node_service_discovery"} == 0    #报警检测的job是server2节点是否存活
    for: 1m
    labels:
      severity: critical
    annotations:
      description: "Node has been dwon for more than 1 minutes"
      summary: "Node down"

[root@server1 prometheus]# ./promtool check rules /data/prometheus/rules/rules.yml
#用prometheus自带的promtool工具检测rules.yml语法是否正确
Checking rules/rules.yml
  SUCCESS: 1 rules found

[root@server1 ~]# kill -HUP pid 重启服务
完成Alertmanager的部署,可以通过http://192.168.106.10:9093进行访问
警告测试
关闭node_exporter
[root@server2 data]# screen -r node
#进入之前开启的screen
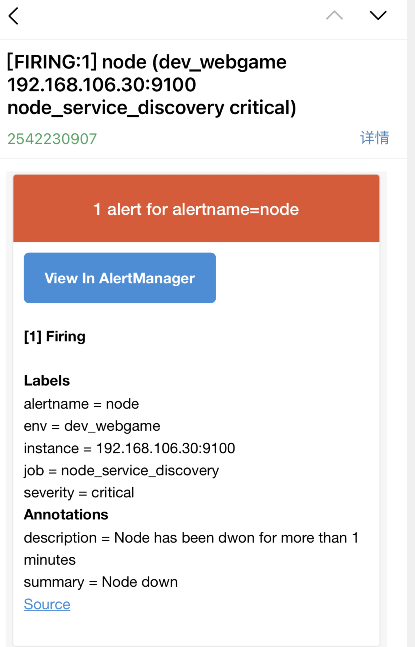
按下ctrl + c服务会自动关闭,若仍然后台运行则现用ps -aux |9100找到pid,再kill -9 pid杀死进程需要等待一段时间,发现http://192.168.106.10:9093中出现红色报警的时候,手机接收到邮件,大概需要1-2min左右的时间
Comments | NOTHING